GDB debugger
The Nucleo-L476RG board includes an embedded ST-Link/V2-1 debugger and programmer. This allows you to program and debug the STM32 microcontroller on the Nucleo board. The ST-Link interface provides a bridge between your development environment and the microcontroller.
Tip
If you are getting an examination failure on openocd and cannot remote connect on gdb:
Info : Listening on port 6666 for tcl connections
Info : Listening on port 4444 for telnet connections
Info : clock speed 500 kHz
Info : STLINK V2J33M25 (API v2) VID:PID 0483:374B
Info : Target voltage: 3.262426
Error: [stm32l4x.cpu] Examination failed               <=============
Warn : target stm32l4x.cpu examination failed
Info : starting gdb server for stm32l4x.cpu on 3333
Info : Listening on port 3333 for gdb connections
(gdb) tar ext:3333
Remote debugging using :3333
Remote connection closed

  **press and hold the reset button** while OpenOCD is connecting.
Tip
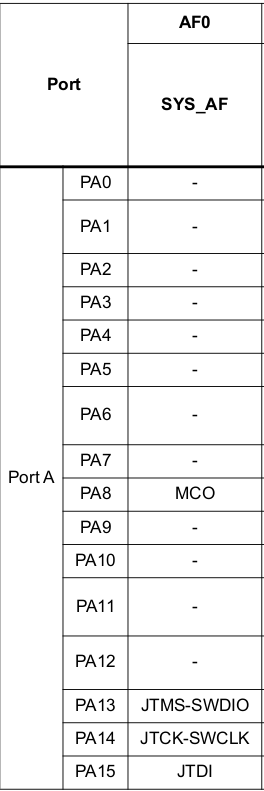
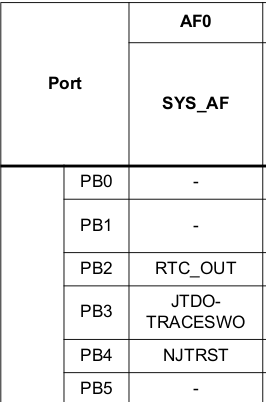
If you want to debug, don’t change the state of ports of GPIO bank A used for debug ports, that is PA13, PA14, PA15 - PB3 and PB4.
If OpenOCD blocks, pull up both BOOT0 and BOOT1. The MCU will boot from internal SRAM on random data. Then flash a working program, OpenOCD will work fine.
Starting the debugger
First, run OpenOCD such that it acts as a GDB server:
openocd -f /home/fhc/openocd/tcl/board/st_nucleo_l4.cfg
Open On-Chip Debugger 0.12.0+dev-01507-g9659a9b5e (2024-02-01-14:42)
Licensed under GNU GPL v2
For bug reports, read
    http://openocd.org/doc/doxygen/bugs.html
Info : The selected transport took over low-level target control. The results might differ compared to plain JTAG/SWD
srst_only separate srst_nogate srst_open_drain connect_deassert_srst
Info : Listening on port 6666 for tcl connections
Info : Listening on port 4444 for telnet connections
Info : clock speed 500 kHz
Info : STLINK V2J33M25 (API v2) VID:PID 0483:374B
Info : Target voltage: 3.270295
Info : [stm32l4x.cpu] Cortex-M4 r0p1 processor detected
Info : [stm32l4x.cpu] target has 6 breakpoints, 4 watchpoints
Info : [stm32l4x.cpu] Examination succeed
Info : starting gdb server for stm32l4x.cpu on 3333
Info : Listening on port 3333 for gdb connections
Info : accepting 'gdb' connection on tcp/3333           (responds to gdb command tar ext:3333)

............ if bug
[stm32l4x.cpu] halted due to debug-request, current mode: Handler HardFault
............ if OK
[stm32l4x.cpu] halted due to debug-request, current mode: Thread

xPSR: 0x01000000 pc: 0x08000110 msp: 0x20000400
Info : device idcode = 0x10076415 (STM32L47/L48xx - Rev 4 : 0x1007)
Info : RDP level 0 (0xAA)
Info : flash size = 1024 KiB
Info : flash mode : dual-bank
Info : device idcode = 0x10076415 (STM32L47/L48xx - Rev 4 : 0x1007)
Info : RDP level 0 (0xAA)
Info : OTP size is 1024 bytes, base address is 0x1fff7000
Then, run gdb
$ arm-none-eabi-gdb gpio.elf
GNU gdb (Arm GNU Toolchain 13.2.rel1 (Build arm-13.7)) 13.2.90.20231008-git
Copyright (C) 2023 Free Software Foundation, Inc.
License GPLv3+: GNU GPL version 3 or later <http://gnu.org/licenses/gpl.html>
This is free software: you are free to change and redistribute it.
There is NO WARRANTY, to the extent permitted by law.
Type "show copying" and "show warranty" for details.
This GDB was configured as "--host=x86_64-pc-linux-gnu --target=arm-none-eabi".
Type "show configuration" for configuration details.
For bug reporting instructions, please see:
<https://bugs.linaro.org/>.
Find the GDB manual and other documentation resources online at:
    <http://www.gnu.org/software/gdb/documentation/>.

For help, type "help".
Type "apropos word" to search for commands related to "word"...
Reading symbols from gpio.elf...
(gdb) tar ext:3333
Remote debugging using :3333
Reset_Handler () at gpio.s:32
32        b 1b

(gdb) load
Loading section .text, size 0x4ba lma 0x8000000
Start address 0x08000000, load size 1210
Transfer rate: 3 KB/sec, 1210 bytes/write.
(gdb) r
The program being debugged has been started already.
Start it from the beginning? (y or n) y
Starting program: /home/fhc/y/asm_systick/gpio.elf
Now, examine the contents of the CPU registers:
You can one single instruction by typing s (stepi).
You can interrupt the running program by pressing ‘Ctrl+C’.
target informations
(gdb) i tar
Symbols from "/home/fhc/y/asm_timer_basic2/fhc.elf".
Local exec file:
  `/home/fhc/y/asm_timer_basic2/fhc.elf', file type elf32-littlearm.
  Entry point: 0x8000000
  0x08000000 - 0x08000088 is .text
  0x08000088 - 0x08000168 is .VectorTable
  0x20000000 - 0x20000004 is .data
Sending commands to the debugger
The monitor command allows sending arbitrary commands directly to the remote monitor as OpenOCD debugger.
This command does not work when debugging user space applications that use gdbsever interface instead of OpenOCD debugger path.
In that case, since the GDB does not care about the commands it sends, the monitor command allows to extend the GDB. You can add new commands that only the external monitor understands and implements.
monitor <cmd>
To get the list of cmd commands:
monitor help
 (gdb) monitor adapter name
 hla

(gdb) monitor flash write_image erase fhc.elf
Padding image section 1 at 0x0800016c with 4 bytes (bank write end alignment) Adding extra erase range, 0x08000170 .. 0x080007ff auto erase enabled
GDB - Breakpoints
You can set a breakpoint using a STM32 address
b *0x8000004
GDB - Conditional Breakpoints
Tip
You want a breakpoint to be activated only if a certain condition is met.
Let’s say the condition is to stop when r2 equals 12.
(gdb) b 42
Breakpoint 2 at 0x80000f6: file fhc.s, line 42.

(gdb) condition 2 $r2=12

(gdb) i b
Num     Type           Disp Enb Address    What
2       breakpoint     keep y   0x080000f6 fhc.s:42
stop only if $r2=12

Remove the condition:
(gdb) condition 2
Breakpoint 2 now unconditional.
Examine memory
Print 20 4-byte words from the program counter
x/20x $pc
print instructions
x/20i $pc
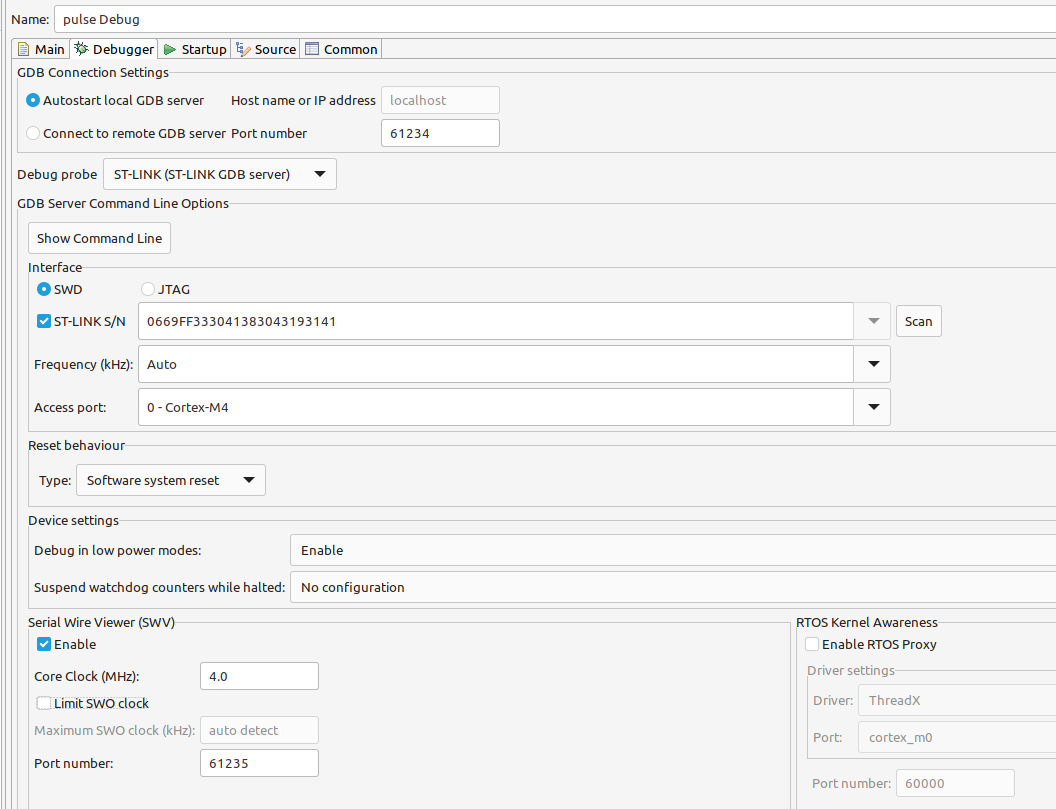
STM32IDE


STM32L476
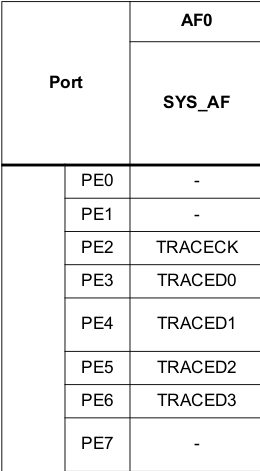
PB3 -> SWO
PA14 -> TCK
PA13 -> TMS
PA5 -> LED
32F401
PB3 -> SYS_JTDO_SWO
PA14 -> SYS_JTCK_SWCLK
PA13 -> SYS_JTMS_SWDIO
- borderless-table
|
|
|
Serial Wire Debug (SWD)
Disable peripherals in debug mode on STM32F4xx
Have you ever used watchdog in your application?
Have you ever debug your application when watchdog was enabled and you hit stop?
Watchdog did not stop in this case and when you pressed “continue” in your debugger, your program starts over because WDG has reset your system.
One choice is that you remove line where you initialize IWDG, but you then must recompile and redownload and all that stuff. Wasting useful time.
To avoid this problem, STM32 devices have possibility to disable some peripherals when you are in debug mode. And one of that peripherals is also WDG timer which won’t count and won’t reset your system when you will be in debug mode, even if you enable it somewhere in your code.
This gives you a possibility to STOP execution in your program (breakpoint) anytime and continue program without worries about system reset.
DBGMCU (DeBuG MicroController Unit) is called section in STM32 with possibility to disable other peripherals when you are in debug mode.
For STM32L4xx series, you can disable these peripherals:
/* Bit definition for DBGMCU_APB1FZR1 register */ DBGMCU_APB1FZR1_DBG_TIM2_STOP DBGMCU_APB1FZR1_DBG_TIM3_STOP DBGMCU_APB1FZR1_DBG_TIM4_STOP DBGMCU_APB1FZR1_DBG_TIM5_STOP DBGMCU_APB1FZR1_DBG_TIM6_STOP DBGMCU_APB1FZR1_DBG_TIM7_STOP
DBGMCU_APB1FZR1_DBG_RTC_STOP DBGMCU_APB1FZR1_DBG_WWDG_STOP DBGMCU_APB1FZR1_DBG_IWDG_STOP DBGMCU_APB1FZR1_DBG_I2C1_STOP DBGMCU_APB1FZR1_DBG_I2C2_STOP DBGMCU_APB1FZR1_DBG_I2C3_STOP DBGMCU_APB1FZR1_DBG_CAN_STOP DBGMCU_APB1FZR1_DBG_LPTIM1_STOP
/* Bit definition for DBGMCU_APB1FZR2 register */ DBGMCU_APB1FZR2_DBG_LPTIM2_STOP
/* Bit definition for DBGMCU_APB2FZ register */ DBGMCU_APB2FZ_DBG_TIM1_STOP DBGMCU_APB2FZ_DBG_TIM8_STOP DBGMCU_APB2FZ_DBG_TIM15_STOP DBGMCU_APB2FZ_DBG_TIM16_STOP DBGMCU_APB2FZ_DBG_TIM17_STOP
/* Include core modules */ #include “stm32f4xx.h” .. code_block
int main(void) {
/* Disable watchdog when we are in debug mode */ DBGMCU->APB1FZ |= DBGMCU_IWDG_STOP;
/* Initialize watchdog timer / / Set timeout to 1s / / If we are in debug mode, watchdog won’t start even if we enable it */ if (TM_WATCHDOG_Init(TM_WATCHDOG_Timeout_1s)) {
/* System was reset by watchdog */ TM_DISCO_LedOn(LED_RED);
- } else {
/* System was not reset by watchdog */ TM_DISCO_LedOn(LED_GREEN);
}
- while (1) {
/* If button is pressed, do nothing and system will be reset after 1 second */ while (TM_DISCO_ButtonPressed());
/* Reset watchdog */ TM_WATCHDOG_Reset();
}
}
ITM
// Debug Exception and Monitor Control Register base address #define DEMCR ((volatile uint32_t) 0xE000EDFCU )
/* ITM register addresses / #define ITM_STIMULUS_PORT0 *((volatile uint32_t) 0xe0000000) #define ITM_TRACE_EN ((volatile uint32_t) 0xe0000e00)
void ITM_SendChar(uint8_t ch) {
}
In core_cm4.h:
- brief ITM Send Character
- details Transmits a character via the ITM channel 0, and
li Just returns when no debugger is connected that has booked the output. li Is blocking when a debugger is connected, but the previous character sent has not been transmitted.
param [in] ch Character to transmit. returns Character to transmit.
*/
__STATIC_INLINE uint32_t ITM_SendChar (uint32_t ch) {
}

visible when debugging is suspended
When tracing is enabled in the STM32CubeIDE “SWV ITM Data Console” (click on red circle to “Start Trace”), the bits in the ITM->TER register (ITM Trace Enable Register) are set as expected.
In this case, value “80000001” indicates that ports 0 and 31 are enabled.
source [find interface/stlink-v2.cfg] source [find target/stm32f1x.cfg] init tpiu config internal - uart off 72000000 itm ports on
gdb) layout next
nexti
arm-none-eabi-gdb -nw -g3 fhc.elf
flag nw -nowindows -nw “No windows”.
If GDB comes with a graphical user interface (GUI) built in, then this option tells GDB to only use the command-line interface.
stepping mode
change mode
for Instruction Stepping mode, toggle the following button:

the Step Into or Step over